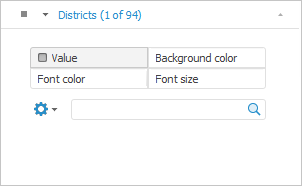
Table data can be displayed by four metrics:
Value.
Background color.
Font color.
Font size.
Warning. The Background Color metrics can be overlapped with condition formatting of data in the table.
When the Background Color, Font Color, Font Size metrics are displayed, metrics legend can be set up.
To set up data displaying in table by several metrics:
Select the fixed dimension, which elements' values will be displayed in table cells, in the Selection group of tabs on the side panel.
Select the Metrics item in the menu of the selected dimension tab. The tab shows radio buttons Value, Background Color, Font Color and Font Size.

Select the required radio button and select the dimension element, which value will be displayed by the selected metrics.
NOTE. Take into account the following feature of scales used for metrics: border values are always included into smaller scale interval. For example, there is a scale with three intervals: smaller than 25, from 25 to 50, bigger than 50. The 25 value will be included into the Smaller than 25 interval, and the 50 value will be included into the From 25 to 50 interval.
The example of table with displaying of data by different metrics:

It enables the user to merge data of all elements selected in fixed dimensions. Aggregation result is passed to a tool visualizer. The aggregation method on dimensions is available for each dimension metric with the Metric role.
The aggregation method is set manually in report or is sent from cube:
If cube facts dimension is set as metric dimension in report, then aggregation type of fixed dimensions for metric is sent from cube depending on the selected dimension element. On changing selected element in dimension, aggregation type is taken from cube till the moment when aggregation type is changed manually in report.
If aggregation method is not determined in cube facts dimension, the Sum aggregation method is set by default in the report.
In case of multiple selection by the Value metric, the aggregation type of the first cube element is applied.
See also: