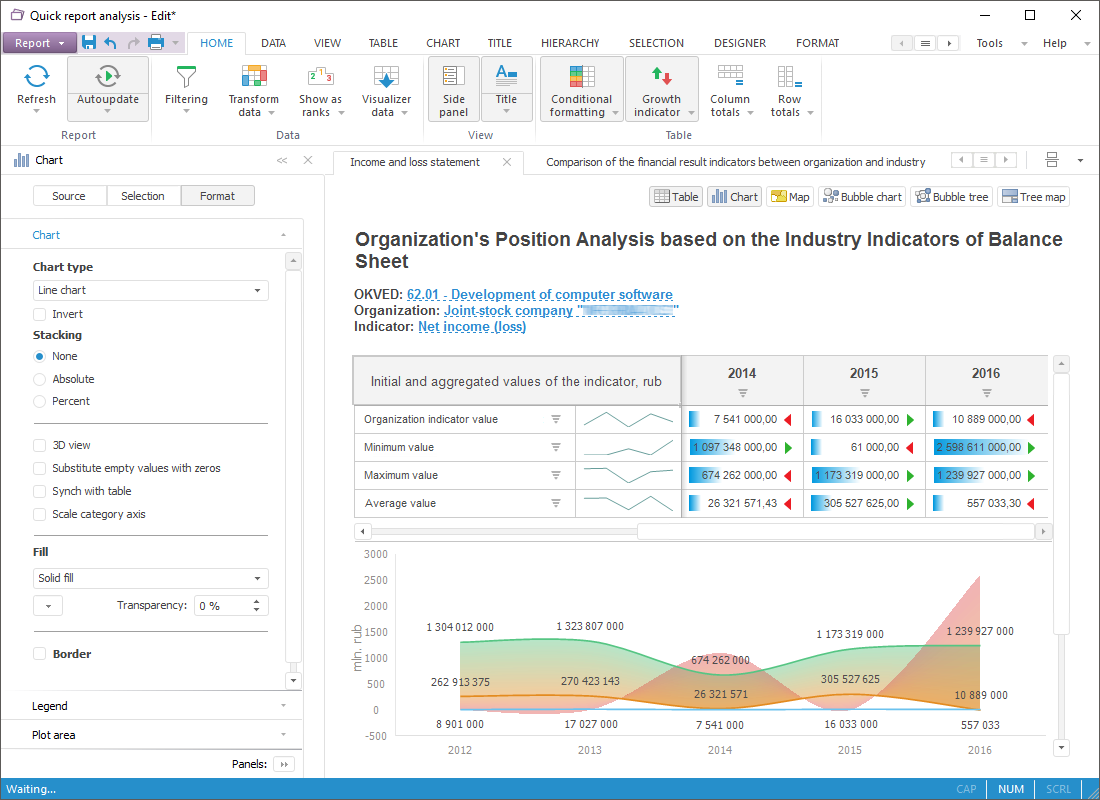
Use the Analytical Queries (OLAP) tool to quickly view and analyze data:

The Analytical Queries (OLAP) tool is used to quickly view and analyze data "on the fly" and display data by by means of business logic.
Key features:
Building ad-hoc requests to data and express analysis by means of various analytical functions.
Setting up filtering, sorting, calculations, 80/20 analysis, building trends, conditional formatting, and so on.
Simultaneous analysis of multiple data sources in one visualizer.
Data drill down and drill up.
Checking data for correspondence with specified conditions and constraints.
Presenting data as interactive visualizers: tables, charts, maps.
Integration with Microsoft Office.
To get started with the tool, see the Getting Started with the Analytical Queries (OLAP) Tool article.
To build an express report, see the Building Express Report article.
To work with a ready express report, see the Working with Ready Express Report article.
If you still have any questions, see the Questions and Answers article.
See also: