Для выполнения примера необходимо создать html-страницу и выполнить следующие действия:
1. Добавить ссылку на css-файлы PP.css и PP.DataGrid.css. Также нужно добавить ссылки на следующие js-файлы:
PP.js;
PP.DataGrid.js.
2. В теге <body> добавить блок с идентификатором «dataGrid» и добавить ссылку на сценарий для создания синхронной таблицы данных:
<body>
    <div id="dataGrid"></div>
    <script src="synchDataSource.js" type="text/javascript"></script>
</body>
3. Создать файл сценария synchDataSource.js:
(function () {
// Заполняет строки таблицы
function createRows() {
var rows = [];
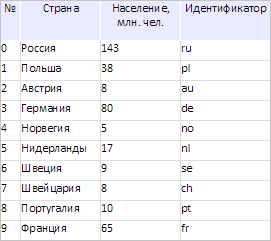
var countries = ["Россия", "Польша", "Австрия", "Германия", "Норвегия",
"Нидерланды", "Швеция", "Швейцария", "Португалия", "Франция"];
var popul = [143, 38, 8, 80, 5, 17, 9, 8, 10, 65];
var ids = ["ru", "pl", "au", "de", "no", "nl", "se", "ch", "pt", "fr", ];
for (var i = 0; i < 10; i++) {
rows.push({
"@I": i,
                "Cells": {
                    "num": {
                        "@SI": "2",
                        "CellData": {
                            "@V": i,
                            "@FT": i + ''
                        }
                    },
                    "country": {
                        "@SI": "2",
                        "CellData": {
                            "@V": countries[i],
                            "@FT": countries[i]
                        }
                    },
                    "popul": {
                        "@SI": "2",
                        "CellData": {
                            "@V": popul[i],
                            "@FT": popul[i]
                        }
                    },
                    "id": {
                        "@SI": "0",
                        "CellData": {
                            "@V": ids[i],
                            "@FT": ids[i]
                        }
                    }
                }
            });
        }
        return rows;
    }
    // Инициализирует строки таблицы
    function initData() {
        var initData = {
            Rows: {
                Row: createRows()
            }
        };
        return initData;
    }
    // Инициализирует измерения таблицы
    function initMeasures() {
        var measures = {
            "@Version": "1",
            "Structure": {
                "@FH": false, // _IsFixedHeader
                "@DRB": "true", // _IsNeedToDrawBorders
                "DefaultRow": {
                    "@H": "20"
                },
                "DefaultColumn": {
                    "@W": "70",
                    "@H": "40"
                },
                "Rows": {
                    "Row": []
                },
                "Columns": {
                    "Column": [{
                        Title: '№', // Обязательно
                        Width: '20',
                        IsVisible: true,
                        IsBand: false,
                        Enabled: true,
                        EnableColumnResize: true,
                        EnableColumnMove: true,
                        EnableSort: true,
                        Name: "num",  // Обязательно
                        StyleIndex: 2,
                        CellType: 'num',
                        RenderEditor: false,
                    }, {
                        Title: 'Страна', // Обязательно
                        Width: '80',
                        IsVisible: true,
                        IsBand: false,
                        Enabled: true,
                        EnableColumnResize: true,
                        EnableColumnMove: true,
                        EnableSort: true,
                        Name: "country",  // Обязательно
                        StyleIndex: 2,
                        CellType: 'string'
                    }, {
                        Title: 'Население, млн. чел.', // Обязательно
                        Width: '80',
                        IsVisible: true,
                        IsBand: false,
                        Enabled: false,
                        EnableColumnResize: true,
                        EnableColumnMove: true,
                        EnableSort: true,
                        Name: "popul",  // Обязательно
                        Editor: {
                            PPType: "PP.Ui.NumberEdit",
                            MaxValue: 1000,
                            MinValue: 0
                        },
                        StyleIndex: 2,
                        CellType: 'num',
                    }, {
                        Title: 'Идентификатор', // Обязательно
                        Width: '90',
                        IsVisible: true,
                        AutoSize: false,
                        IsBand: false,
                        Enabled: true,
                        EnableColumnResize: true,
                        EnableColumnMove: true,
                        EnableSort: true,
                        Name: "id",  // Обязательно
                        StyleIndex: 2,
                        RenderEditor: false,
                        CellType: 'string',
                    }]
                }
            },
            "Styles": {
                "Style": []
            }
        };
        return measures;
    }
    // Создаёт источник данных
    function createDataSource() {
        var dataSource = new PP.Ui.DGDataSource({
            DefaultRowHeight: 30,
            Measures: initMeasures(),
            Data: initData()
        });
        return dataSource;
    }
    // Создаёт таблицу данных
    function createDataGrid() {
        var grid = new PP.Ui.DataGrid({
            DataLoaded: function(sender, args) {
                // Обрабатываем событие загрузки данных
                var loadDataEventData = args.getData();
                if(loadDataEventData.Rows.Row) {
                    console.log("В таблицу загружены %s рядов данных", loadDataEventData.Rows.Row.length);
                }
            },
            Height: 280,
            ParentNode: document.getElementById('dataGrid'),
            DataSource: createDataSource(),
            ScrollType: PP.Ui.DataGridScrollType.ByRow,
            ImagePath: "../../build/img/",
            RowsToBuffer: 10,
            Width: 280
        });
        return grid;
    }
    // Создаём таблицу данных
    grid = createDataGrid();
})();
В результате выполнения примера на html-странице была размещена таблица с данными, загруженными синхронно:
В консоли браузера была выведена информация о количестве загруженных рядов данных:
В таблицу загружены 10 рядов данных
См. также: